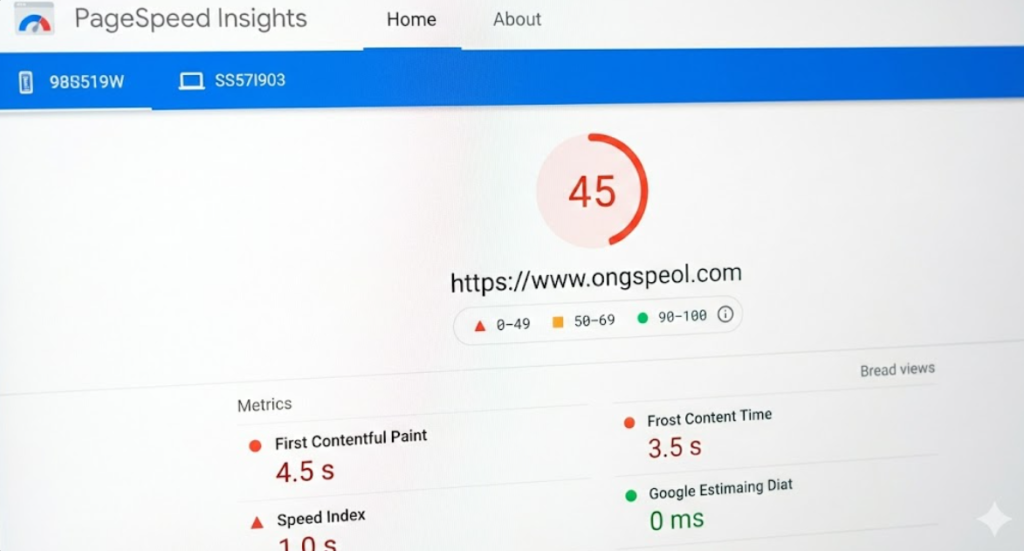
In 2026, page speed optimization has transitioned from being a nice-to-have to an absolute necessity for SEO success. Google has made it crystal clear: websites that prioritize performance rank higher than slower competitors. If your pages load slowly, visitors leave, bounce rates spike, and your rankings plummet—even if your content is exceptional.

Introduction: Why Page Speed Matters for Your Search Rankings
This comprehensive guide covers everything you need to know about Google PageSpeed Index optimization, Core Web Vitals, and actionable tactics to improve your site’s speed and climb the search rankings. Whether you’re a beginner or experienced webmaster, you’ll discover proven techniques to achieve green scores on PageSpeed Insights and attract more organic traffic.
What is Google Page Speed Index? Understanding Lighthouse Metrics
Defining Speed Index and Why It Matters
Speed Index is a critical Lighthouse performance metric that measures how quickly visible page content loads during the loading process. Unlike simple load time measurements, Speed Index captures the visual completeness of your page from the user’s perspective, focusing on what appears “above the fold”—the content visible without scrolling.
Lighthouse (Google’s performance testing tool) records a video of your page loading and analyzes each frame to calculate how quickly content is visually displayed. This metric reflects the real user experience, not just technical measurements.
Speed Index Benchmarks: What Are Good Scores?
Understanding where your site stands is the first step in page speed optimization. Here are the industry benchmarks:
Mobile Devices:
- 0–3.4 seconds: Green (fast) — Score 75-100
- 3.4–5.8 seconds: Orange (moderate) — Score 50-74
- Above 5.8 seconds: Red (slow) — Score 0-49
Desktop Devices:
- 0–1.3 seconds: Green (fast) — Score 75-100
- 1.3–2.3 seconds: Orange (moderate) — Score 50-74
- Above 2.3 seconds: Red (slow) — Score 0-49
In Lighthouse v12, Speed Index accounts for 10% of your overall performance score, but it correlates strongly with two critical metrics: First Contentful Paint (FCP) and Largest Contentful Paint (LCP). Achieving a green Speed Index helps improve your entire performance profile.
Core Web Vitals: The Three Metrics Google Uses to Rank Your Site
While Speed Index is important, Google’s Core Web Vitals (CWV) are what directly impact your search rankings. These three metrics form the foundation of Google’s “page experience” ranking factor.

1. Largest Contentful Paint (LCP): Loading Performance
LCP measures how long it takes for the largest image or text block in the viewport to load. This directly reflects when users perceive your page as “ready to use.”
Good Threshold: Below 2.5 seconds
Needs Improvement: 2.5–4.0 seconds
Poor: Above 4.0 seconds
Why It Matters for SEO:
LCP carries a 35% weight in Google’s overall PageSpeed score. If your LCP is poor, you’re automatically at a disadvantage against faster competitors. Pages that load their main content quickly see better rankings and higher conversion rates. If your website solely depends on Organic SEO then this is very important.
Quick Wins to Improve LCP:
- Preload critical resources with
<link rel="preload"> - Optimize and compress images (target 800ms improvement)
- Use a Content Delivery Network (CDN) to serve content from locations closer to users
- Reduce server response time (TTFB)
2. Cumulative Layout Shift (CLS): Visual Stability
CLS measures how much your page layout shifts after initial load. When images suddenly appear, advertisements load, or fonts change, users experience frustration. This metric quantifies unwanted movement.
Good Threshold: Below 0.1
Needs Improvement: 0.1–0.25
Poor: Above 0.25
Why It Matters for SEO:
Poor CLS signals bad user experience. While CLS has lower weight than LCP, it’s critical for user trust and engagement. High CLS increases bounce rates and reduces dwell time—both negative ranking signals.
Quick Wins to Improve CLS:
- Set width and height attributes on all images and videos
- Reserve space for ads, embeds, and dynamic content
- Use CSS transforms instead of properties that trigger layout
- Avoid inserting content above existing content
3. Interaction to Next Paint (INP): Responsiveness
INP replaced First Input Delay (FID) in March 2024 and measures how quickly your page responds to user interactions like button clicks, form submissions, and keyboard input.
Good Threshold: Below 200 milliseconds
Needs Improvement: 200–500 milliseconds
Poor: Above 500 milliseconds
Why It Matters for SEO:
INP directly impacts how users perceive your site’s responsiveness. Slow interactions frustrate visitors and increase bounce rates. Google now prioritizes this metric heavily in its ranking algorithm.
Quick Wins to Improve INP:
- Reduce JavaScript execution time through code optimization
- Defer non-critical JavaScript loading
- Use
asyncanddeferattributes correctly on script tags - Break long tasks into smaller chunks and yield to the browser’s main thread
The Mobile-First Indexing Factor: Why Mobile Speed Dominates
Google prioritizes mobile performance above all else. Since Google switched to mobile-first indexing, your site’s mobile Core Web Vitals determine your search visibility more than desktop scores.
According to industry research, achieving mobile Core Web Vitals scores of 90+ is essential. If your mobile speed fails, your desktop performance barely matters. A typical impact: improving mobile speed can take 2-5 days to reflect in rankings.
Mobile-Specific Optimization Tips:
- Test on actual mobile devices, not just desktop
- Optimize images for mobile screens (crop center for 500px width on phones)
- Reduce render-blocking JavaScript
- Minimize CSS and JavaScript payloads
- Use responsive design with appropriate image sizes

Practical Strategies to Improve Page Speed and Rank Higher
1. Master Image Optimization: The Biggest Performance Killer
Images typically account for 40-50% of page weight. Poorly optimized images destroy your speed scores and SEO rankings.
Image Optimization Techniques:
Convert to WebP Format:
WebP is Google’s modern image format offering superior compression:
- 26% smaller than PNG (lossless)
- 25-34% smaller than JPEG (lossy, at equivalent quality)
- Supports both lossy and lossless compression, plus animation
Use <picture> tags to serve WebP to supporting browsers while maintaining JPEG/PNG fallbacks:
<picture>
  <source srcset="image.webp" type="image/webp">
  <img src="image.jpg" alt="description">
</picture>
Compress Images Aggressively:
- Use tools like TinyPNG, ShortPixel, or Optimole
- Aim for maximum quality with minimum file size
- Remove unnecessary metadata (EXIF data)
- Use lossy compression for photographs, lossless for graphics
Implement Responsive Images:
- Use
srcsetandsizesattributes so browsers fetch the smallest needed asset - Create multiple image sizes for different devices
- Pair with lazy loading for below-the-fold images
Mobile Image Strategy:
- Crop landscape images to focus on center content for mobile (no off-screen pixels)
- Create separate mobile versions if significant visual change is needed
- Serve mobile images at 500px width or less
- Preload mobile landing images in the
<head>tag
Expected Improvement: 800-1200ms LCP reduction
2. Optimize JavaScript: Stop Blocking Your Rendering
JavaScript is the second biggest culprit slowing down pages. Synchronous scripts block HTML parsing entirely, delaying content visibility.
Defer vs. Async: Which Should You Use?
Deferred JavaScript (defer attribute):
- Scripts load in background without blocking HTML parsing
- Execute after HTML is fully parsed
- Maintain script execution order
- Best for: Scripts that depend on the DOM or each other
<script src="main.js" defer></script>Asynchronous JavaScript (async attribute):
- Scripts load in background without blocking parsing
- Execute immediately when downloaded (may interrupt parsing)
- Don’t maintain order
- Best for: Independent scripts like analytics or third-party widgets
<script src="analytics.js" async></script>Pro Tip: Defer your critical scripts and use async only for truly independent code.
Reduce JavaScript Execution Time:
- Break long tasks into smaller chunks
- Yield to the browser’s main thread periodically
- Remove unused JavaScript with tree-shaking
- Minify and compress all JS files (targets 30-40% size reduction)
- Use modern JavaScript features and frameworks that generate efficient code
Third-Party Script Management:
Third-party scripts (analytics, ads, widgets, fonts) can add 500-1500ms to load times or block the main thread for up to 1640ms. This is critical to manage:
- Audit and remove unnecessary scripts monthly
- Load third-party scripts with
asyncordefer - Use resource hints like
<link rel="preconnect">and<link rel="dns-prefetch"> - Consider self-hosting critical third-party scripts
- Lazy-load widgets that aren’t immediately needed
Expected Improvement: INP reduction of 150-300ms
3. Minify CSS and HTML: Reduce Render-Blocking Overhead
Minification removes unnecessary whitespace, comments, and characters from source code—reducing file size without affecting functionality.
CSS Minification Strategy:
- Remove spacing, indentation, newlines, and comments
- Use tools like CSSNano or CSS Minify
- Extract critical CSS needed for above-the-fold content
- Defer non-critical CSS loading
- Combine multiple CSS files to reduce HTTP requests
HTML Minification:
- Use HTML Minifier or similar tools
- Feed minified output into production build pipelines
- Remove unnecessary attributes and whitespace
Expected Improvement: Faster FCP by 100-200ms
4. Leverage Browser Caching: Speed Up Repeat Visits
Browser caching stores static resources (images, CSS, JS, fonts) on users’ devices, eliminating re-downloads on subsequent visits.
Implementation Tactics:
- Set HTTP cache headers (Cache-Control, Expires)
- Configure appropriate expiration times
- Use long-term caching for versioned assets (add hash to filename)
- Enable server-side caching with tools like Varnish or Nginx FastCGI cache
- Implement application-level caching for WordPress sites using WP Rocket or W3 Total Cache
- Use object caching with Redis or Memcached for database queries
Expected Improvement: 50-70% faster repeat page loads
5. Implement a Content Delivery Network (CDN): Go Global
A CDN distributes your content across multiple servers worldwide, serving users from geographically closer locations. This dramatically reduces latency and improves TTFB globally.
How CDNs Help Speed Index:
- Serve static assets (images, CSS, JS) from edge locations
- Cache HTML on CDN edge nodes for minimal Time to First Byte (TTFB)
- Reduce bandwidth consumption
- Provide automatic image optimization
- Enable HTTP/2 and HTTP/3 protocols
Popular CDN Services:
- Cloudflare (free + paid tiers)
- Fastly
- Akamai
- Bunny CDN
For Dynamic Websites:
Use CDN with full-page caching or edge computing capabilities (Cloudflare APO, Vercel Edge Functions) to cache HTML dynamically.
Expected Improvement: 300-600ms reduction in load times globally
6. Reduce Server Response Time (TTFB)
Time to First Byte (TTFB) measures how long your server takes to respond with the first byte of HTML. High TTFB indicates backend processing bottlenecks.
Tactics to Reduce TTFB:
Upgrade Your Hosting:
- Move from shared hosting to VPS or managed hosting
- VPS hosting can cut TTFB by 50%
- Choose hosting optimized for performance
Optimize Backend Code:
- Profile and optimize slow PHP/application code
- Use modern frameworks and best practices
- Keep frameworks and languages updated (PHP 8 is 2x faster than PHP 5.6)
Database Optimization:
- Use efficient database systems (MariaDB > MySQL)
- Write optimized queries with proper indexing
- Implement object caching (Redis, Memcached)
- Clean up and maintain database regularly
Implement Full-Page Caching:
- Generate static HTML versions of pages
- Use caching plugins for WordPress (WP Rocket, FlyingPress)
- Serve cached versions from CDN edge nodes
Use Load Balancing:
Distribute traffic across multiple servers for logged-in users and dynamic content.
Expected Improvement: 500ms+ TTFB reduction
7. Optimize the Critical Rendering Path
The critical rendering path is the sequence of steps browsers take to convert HTML, CSS, and JavaScript into a visible webpage.
Steps in the Rendering Process:
- Download and parse HTML → Create DOM
- Download and process CSS → Create CSSOM
- Combine DOM + CSSOM → Create Render Tree
- Calculate layout dimensions and positions
- Paint pixels to screen
Optimization Tactics:
Prioritize Above-The-Fold Content:
- Structure HTML to load critical content first
- Use preload resource hints for critical images and fonts
Minimize Critical Resources:
- Inline critical CSS needed for initial render
- Defer non-critical stylesheets
- Delay JavaScript that doesn’t impact initial render
Use Resource Hints:
<!-- Preload critical resources -->
<link rel="preload" href="font.woff2" as="font" type="font/woff2" crossorigin>
<link rel="preload" href="critical.css" as="style">

<!-- Preconnect to third-party domains -->
<link rel="preconnect" href="https://api.example.com">

<!-- DNS prefetch for non-critical origins -->
<link rel="dns-prefetch" href="https://cdn.example.com">

<!-- Prefetch for future page navigation -->
<link rel="prefetch" href="next-page.html">
Expected Improvement: 200-400ms reduction in FCP/LCP
8. Enable GZIP and Brotli Compression
Compressing files before transmission reduces bandwidth and load times (though technically this affects overall response time, not TTFB).
Implementation:
- Enable GZIP compression in server settings (Apache, Nginx)
- Use Brotli compression for better compression ratios
- Compress CSS, JavaScript, and text files
- Decompress is automatic in browsers
Expected Improvement: 30-60% reduction in transfer size
9. Use Lazy Loading for Images and Videos
Lazy loading defers loading of images and videos until users scroll near them, reducing initial payload and improving perceived page speed.
Implementation:
- Use native
loading="lazy"attribute in img tags (modern browsers) - Implement lazy loading plugins for older browsers
- Apply to below-the-fold images and videos
- Don’t lazy-load above-the-fold critical images
<img src="image.jpg" loading="lazy" alt="description">Expected Improvement: 300-500ms reduction in initial load time for image-heavy pages

Measuring Progress: Tools to Test Your Page Speed
Google PageSpeed Insights (PSI): The Gold Standard for SEO
Why use it: PSI is Google’s official tool using real Core Web Vitals data from Chrome User Experience Report (CrUX). Scores here directly reflect what Google sees when ranking your site.
Advantages:
- Free tool
- Uses real user data (field data) + lab data
- Mobile-first testing
- Directly tied to ranking factors
- Actionable recommendations
Access: pagespeed.web.dev
GTmetrix: The Developer’s Choice
Why use it: GTmetrix uses actual Chrome browser testing with customizable conditions, offering more detailed waterfall analysis than PSI.
Advantages:
- Simulates real-world browser behavior
- Test from multiple locations globally
- Customize connection speeds and devices
- Detailed asset waterfall view
- Identifies specific performance bottlenecks
When to use it: For in-depth performance analysis and comparing against competitors
Chrome DevTools Lighthouse: Built Into Your Browser
Run free local performance audits directly in Chrome DevTools. Great for real-time testing during development.
Answering Common Questions About Page Speed and SEO
Does page speed directly guarantee top rankings?
How long does it take for speed improvements to affect rankings?
Is desktop speed as important as mobile speed?
Can I achieve 100/100 on PageSpeed Insights?
How often should I test my page speed?
What if my speed score improved but rankings didn’t?
Conclusion: Speed is the Price of Entry in 2026
In 2026, page speed optimization for SEO is non-negotiable. Google has made Core Web Vitals and page experience explicit ranking factors, and 47% of websites still fail to meet these thresholds—creating an opportunity for those who optimize.
The strategies in this guide—image optimization, JavaScript deferment, caching, CDN implementation, and critical rendering path optimization—directly improve Speed Index and Core Web Vitals scores. Even modest improvements compound: a 2-second load time reduction can boost conversions by 10-15% and significantly improve search visibility.
Your action plan:
- Test your site on PageSpeed Insights today
- Identify your biggest bottlenecks
- Implement quick wins (image optimization, caching, deferring JS)
- Monitor progress weekly
- Plan strategic improvements for long-term excellence
Remember: speed isn’t just about rankings. It’s about respecting user time and providing exceptional experience. Websites that load fast keep visitors engaged, reduce bounce rates, and ultimately convert better.
Start optimizing today and watch your search rankings climb.
Key Takeaways
- Speed Index measures how quickly page content becomes visually visible to users
- Core Web Vitals (LCP, CLS, INP) are confirmed Google ranking factors affecting 75%+ of page visits
- Mobile-first performance matters more than desktop in 2026
- Image optimization yields the biggest quick wins (800-1200ms improvements)
- JavaScript optimization with defer/async and third-party script management prevents rendering delays
- Browser caching and CDNs dramatically improve load times globally
- Monitor with PageSpeed Insights for SEO-relevant metrics and GTmetrix for detailed analysis
- Consistent green scores (75+) across metrics outperform perfect but unrealistic 100/100 targets


Leave a Reply